A sideways look at economics
I frequently moan about low levels of investment in the UK. It has become a bugbear of mine. Looking across the whole of the G7, the UK has had the lowest investment-to-GDP-ratio in 28 of the past 42 years. And on those odd occasions when it has not been bottom of the G7 investment league table, it has been close. I blogged about this subject as recently as February this year, when I contrasted my willingness to extend my mortgage in order to carry out improvements to my home,[1] with the then government’s insistence on seeking to balance the books at all costs, and not to borrow even to invest.
The first time I touched on this subject in a Thank Fathom it’s Friday post was five years ago, when I marked the departure of the last scheduled InterCity 125 train by observing that, during its more than 40 years of service, the shortest journey time from London to Bath had actually increased, from 71 to 83 minutes. When it came to rail transport, it seemed, we were not investing enough even to stand still. In that piece, I referred to Frank Ramsey’s ‘A mathematical theory of saving’. As long ago as 1928, the Cambridge polymath showed how, in principle, patient individuals will tend to save more; and by extension patient nations will tend to invest more. Perhaps Britons were simply a ‘jam today’ kind of people, living for the moment – in which case, I concluded, maybe we just had to accept our lot? But an interesting paper that I discovered recently casts doubt on that assertion.
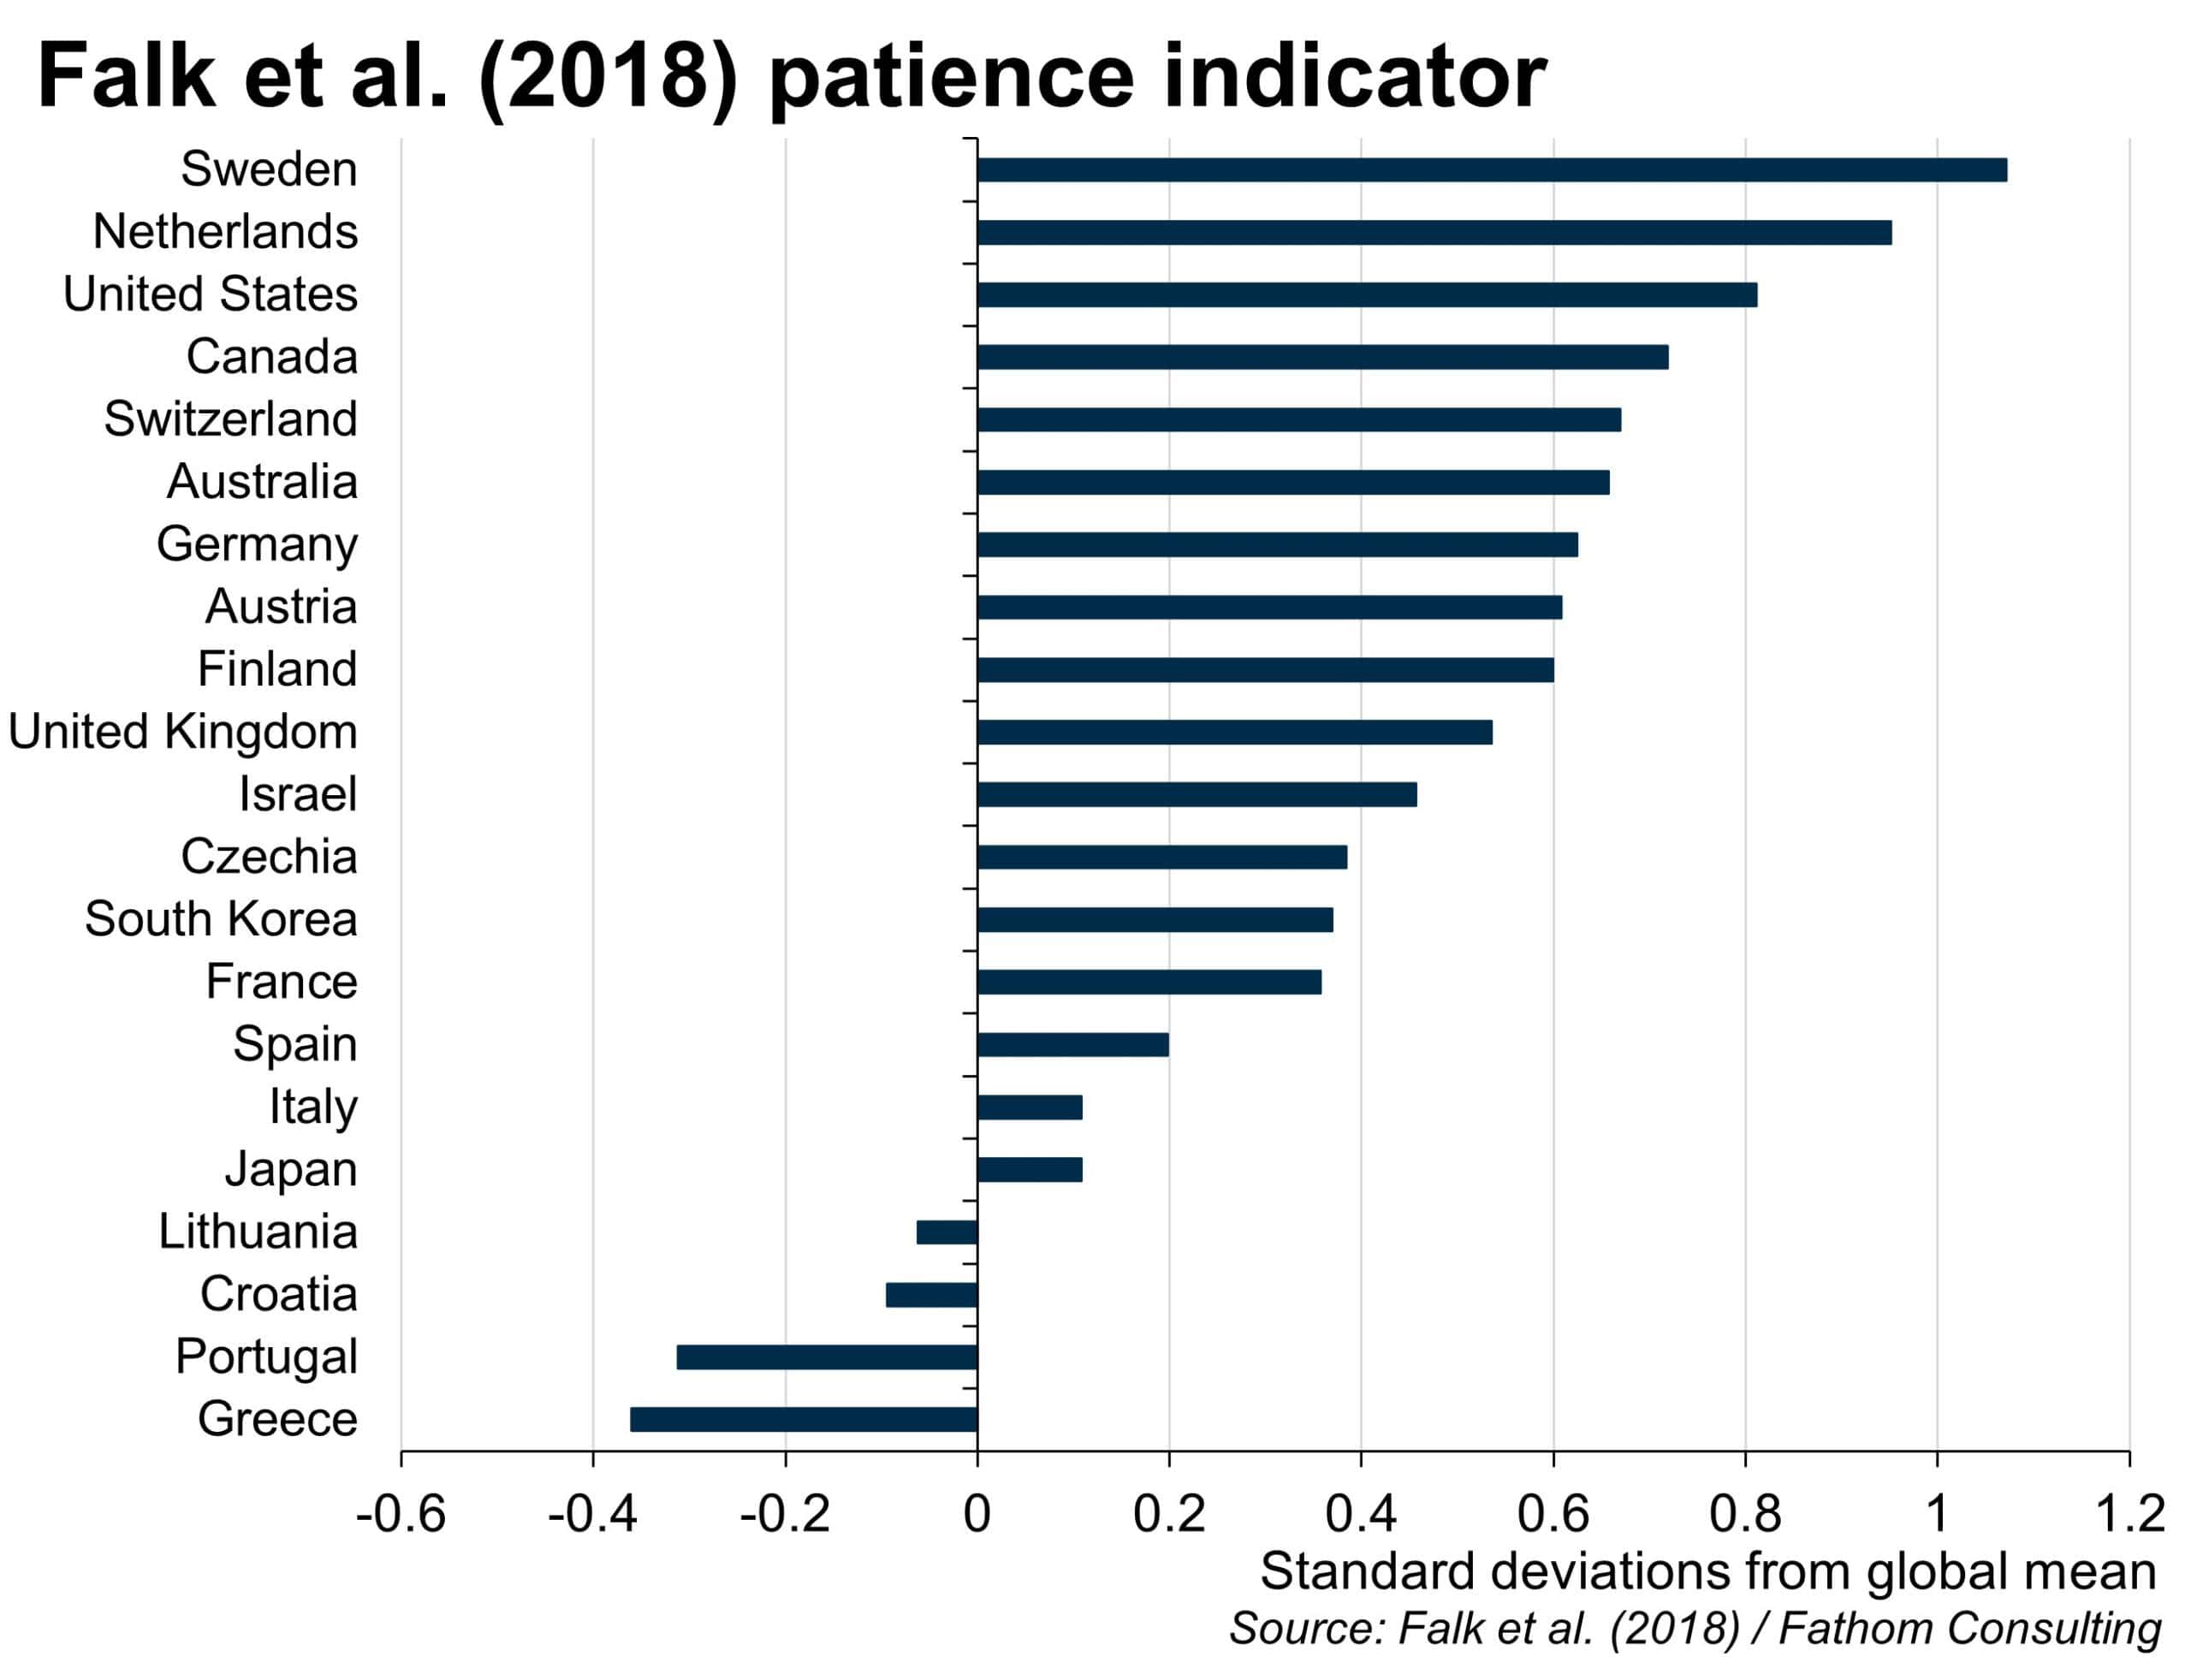
In ‘Global evidence on economic preferences’, Armin Falk and his five co-authors present evidence on a number of behavioural parameters that are central to many economic models of human behaviour. Drawing on a survey of 80,000 people from 76 countries around the world, conducted by Gallop in 2012 and including a mix of both qualitative and quantitative questions, the paper describes the variation in, among other things: attitudes to risk taking; the prevalence of altruism and trust in society; and, central to our purposes, the degree of patience. The countries sampled were a mix of advanced and developing economies, and each metric was presented as a z-score, normalised to have a mean of zero and a standard deviation of one across all 80,000 individuals sampled. The chart below shows the average degree of patience that the authors found across the 21 advanced economies in the survey, with a higher z-score implying a higher degree of patience.[2]

Among the advanced nations, it is the Swedes who appear most patient. Least keen to wait are the Greeks, with Portugal not far behind. The UK is middling, with Brits more patient than their immediate neighbours to the south, but less patient than the Germans. Indeed, with hints of a European North-South divide, this survey may be viewed by some as confirming a number of stereotypes… but let’s not dwell there.
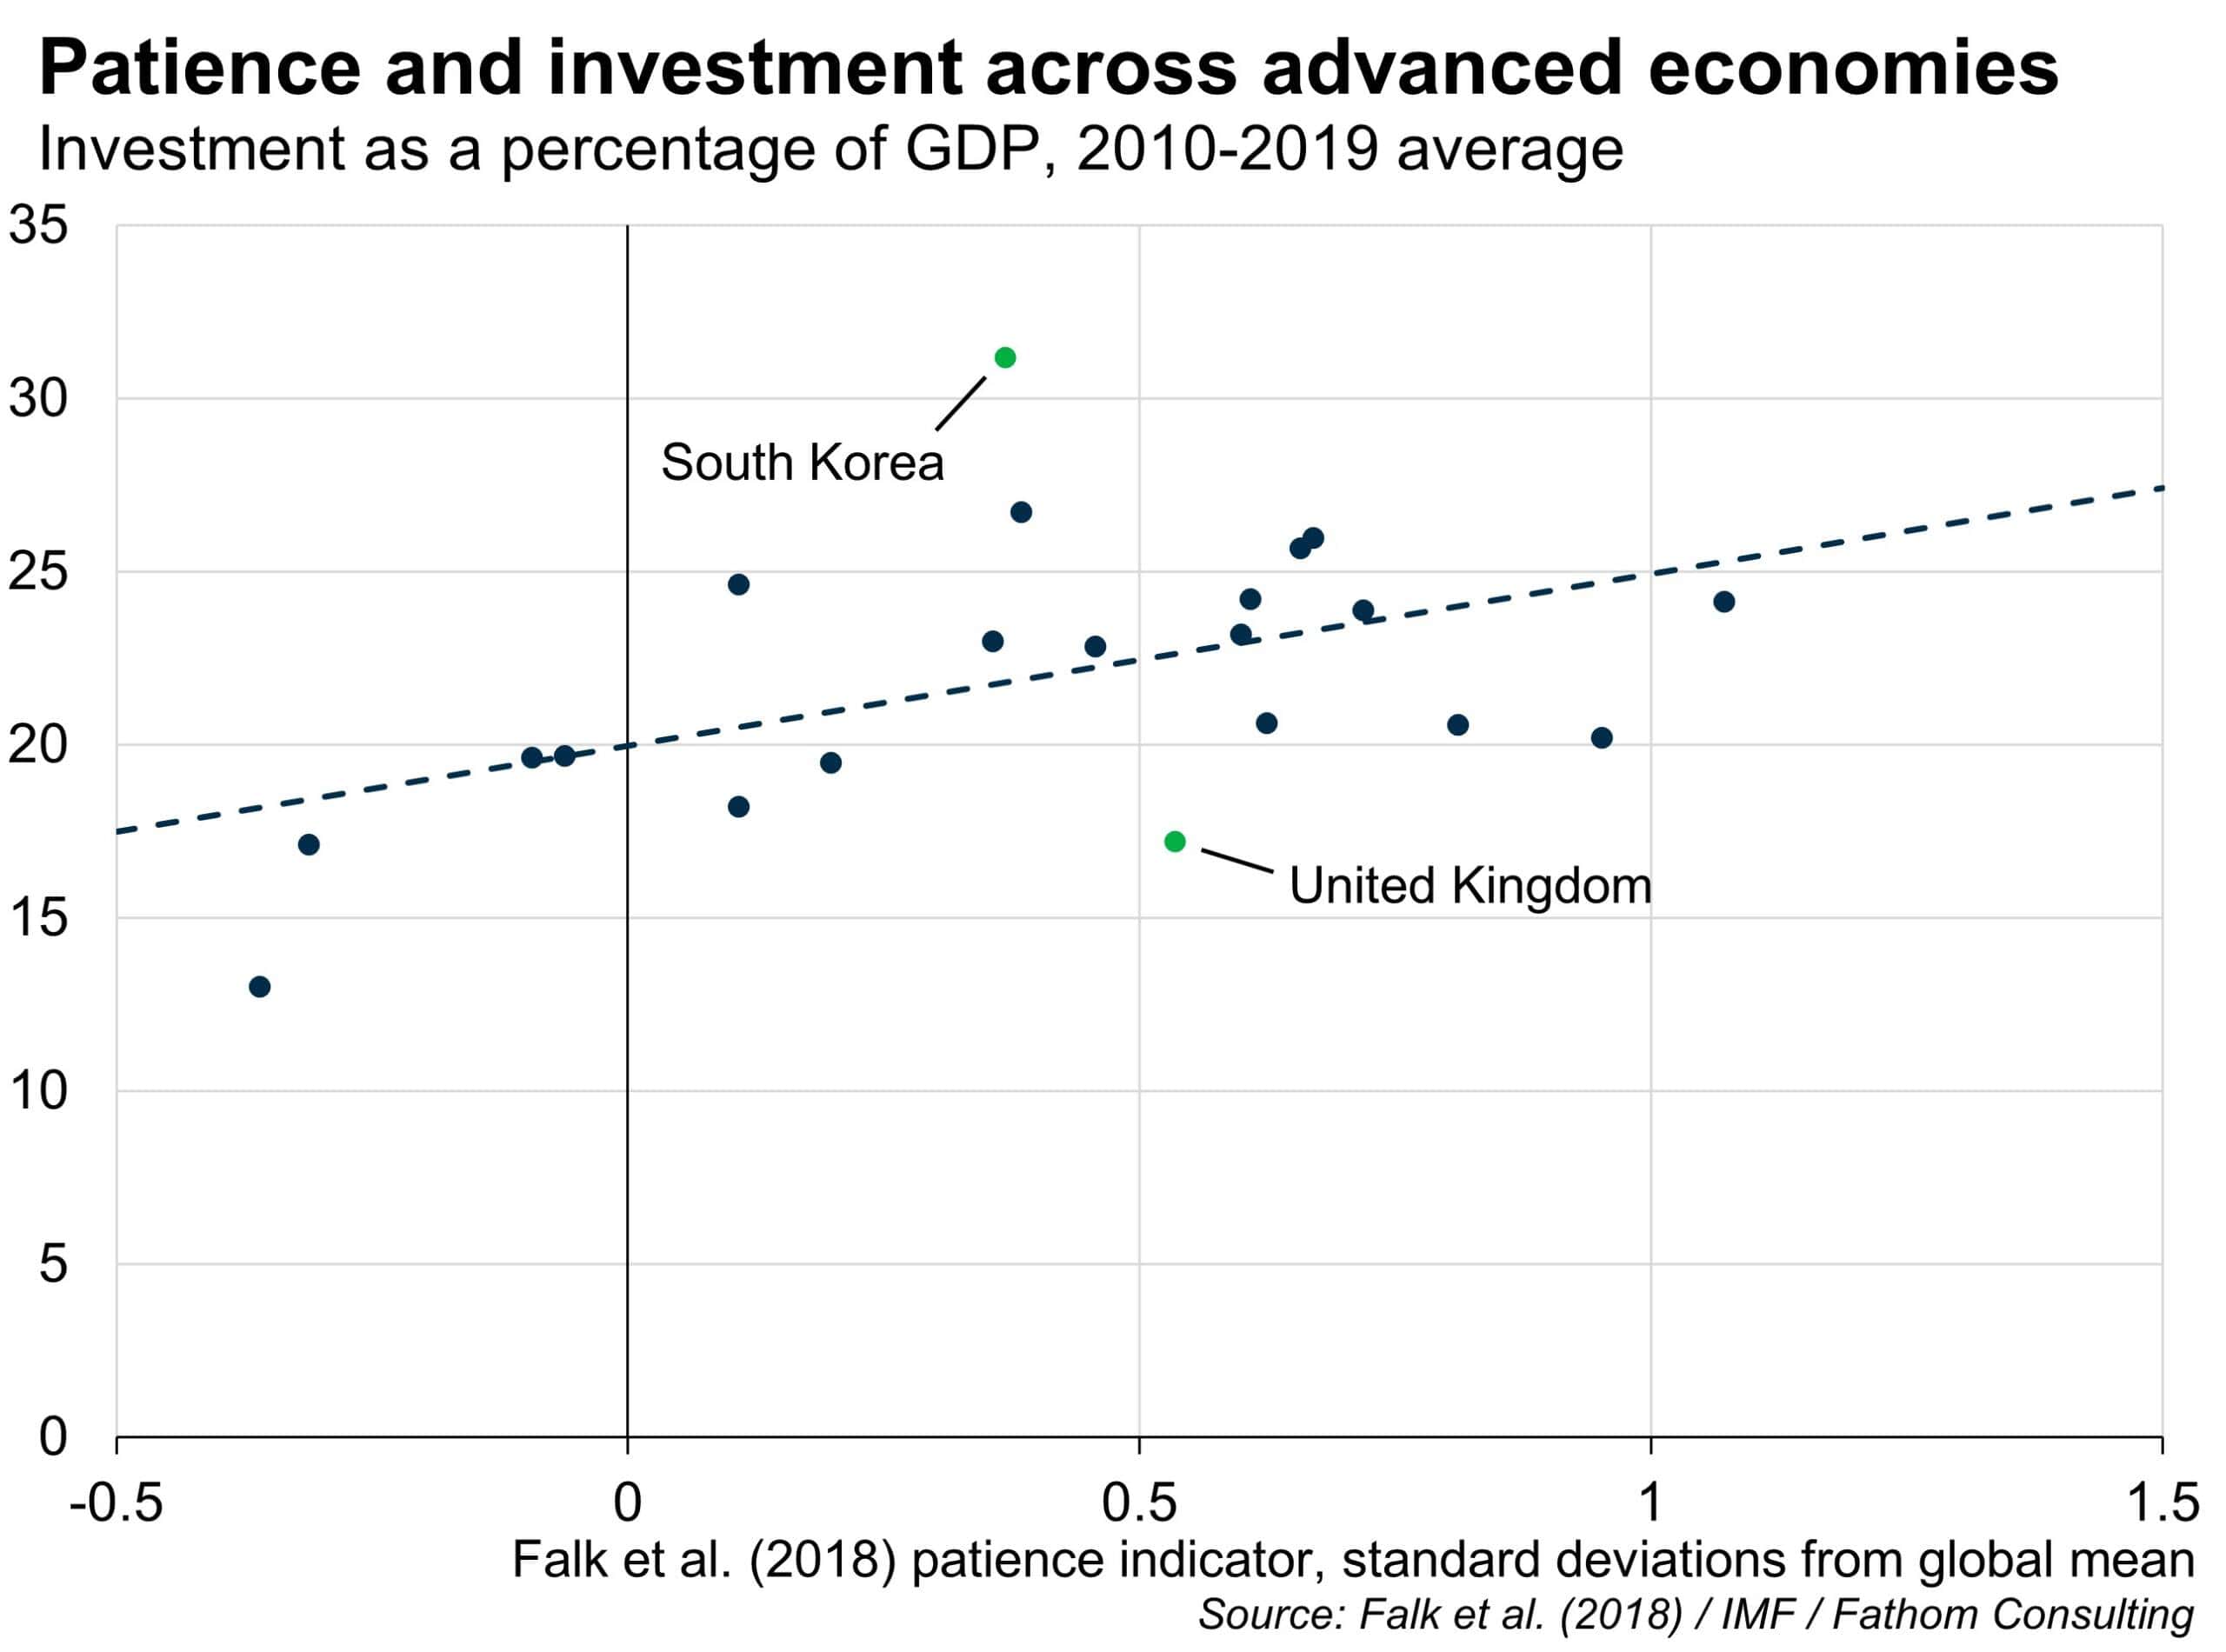
How well can the estimates of patience derived by Falk and his co-authors account for the variation in levels of investment across countries? Well, they certainly provide some insight, as my second chart shows – the correlation between the patience indicator, sampled in 2012, and the average ratio of investment to GDP in the ten years leading up to the pandemic, is 0.48. But there are clearly other factors at work here, as one might expect.

The quantity of investment undertaken in a country will depend on more than the patience of its citizens.[3] The expected return to investment projects undertaken within a country, after adjusting for risk, will also be an important driver.[4] A nation’s GDP per capita provides a crude proxy for expected investment returns, and yet this adds nothing to our model’s ability to explain investment-to-GDP ratios. Government incentives towards investment, such as investment grants – often made available for some of the more socially beneficial yet risky forms of investment such as R&D – are likely to be relevant too, as is the overall corporate tax structure. Whatever the missing ingredient in our model, it is apparent that the shortfall between the level of investment predicted by patience, and the actual level of investment, is greatest for the UK, at just over 5% of GDP. The new Labour government has committed to raising economic growth by strengthening the incentives to invest. Let’s hope it is successful.
[1] By way of an update, the renovations were completed last week, having taken around a third longer than planned, and having exceeded the builder’s initial cost estimate more or less in proportion!
[2] I choose to focus on advanced economies here as I want to draw links between levels of patience and levels of investment. In developing economies, levels of investment are likely to be more heavily influenced by other factors, including the legal and political framework. The fact that the z-scores presented in my chart lie generally above one implies that individuals in advanced economies tend to display higher levels of patience than individuals living in developing economies.
[3] Impatient nations who save little themselves can nevertheless fund investment projects, up to a point, if they are able to borrow from abroad
[4] The Falk et al. (2018) paper also includes a measure of risk attitudes. Simple bivariate correlation analysis suggests that risk-loving nations also tend to invest more, as one might expect – any form of investment is inherently risky. However, there is also a strong degree of correlation between patience and risk attitudes. If we model the investment-to-GDP ratio as a function of both patience and risk attitudes, we find that the risk attitudes indicator has a negative coefficient. It may be that a preference for risk over and above the amount one might expect given the nation’s collective level of patience is an indicator of recklessness, with citizens in those countries tending to fritter away their incomes on unproductive speculation, rather than calculated investments!