A sideways look at economics
It is customary, late on a Friday afternoon, for Fathom to offer its staff a complimentary alcoholic beverage from the company fridge. Collectively, we have a taste for imported wine and beer, as indeed do many people across the UK. Unfortunately, such luxuries have risen substantially in price over the past few months. Fathom’s management, in a textbook case, has responded to the price change accordingly. During the three months to August, the total amount spent on alcohol by the company fell by a remarkable 25%, compared with the previous three-month period. Has this pattern been repeated across the country as a whole? In this week’s TFiF, we take a look.
Sterling has taken a pounding since the UK voted to leave the EU in last year’s referendum. Earlier this week, on a trade-weighted basis, it came within a whisker of its lowest level in 170 years. Against the euro, at airport bureaux de change if not on the London wholesale market, it has gone through parity.
A weaker pound makes for more expensive goods on the High Street. And with wages in cash terms failing to keep pace with rising prices, the spending power of UK households is being eroded. Combined with the already fragile nature of UK personal finances, that is why we see a greater-than-evens chance of a technical recession within the next year. But enough doom and gloom! It’s Friday, and this is meant to be a light-hearted piece.
Consumer prices have risen in the UK, but these price rises have been far from uniform. Those goods and services with a high import content will have risen in price by more than others, while some goods and services may have become cheaper. A large exchange rate move, which affects the prices of some goods and services by more than others, gives us the opportunity to evaluate some basic microeconomic theory.
What should people do when a particular good or service rises in price? Buy less of it, right? Well, not necessarily. Over the years, micro-economists have identified two specific classes of product for which, conceptually at least, the quantity purchased ought to increase following a price rise, and vice versa. To students of economics, the classic example is the Giffen good, named after the Scottish economist, Sir Robert Giffen.
His original example was that of bread. Back in the 19th century, bread was such an essential part of the diet that, were it to rise in price, many poorer families would become materially worse off. Faced with such a large reduction in purchasing power, they would cut back on luxuries, such as meat, which in turn caused them to consume more of the very thing that had risen in price, namely bread.
At the other end of the scale is the Veblen good, named after the US economist, Thorstein Veblen. He argued that, for certain classes of luxury good, it was the very scale of the financial outlay involved in acquiring the product that made it desirable. Make those designer handbags, the price of which vastly exceeds the marginal cost of production, available to anyone by lowering the price and suddenly nobody wants them. Or so the theory goes.
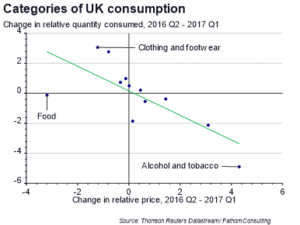
So much for theory, what has happened in practice? Our chart compares the relative change in the price of twelve broad categories of household spending since the vote to leave the EU, with the relative change in the quantity purchased. Each dot represents one of the twelve categories. By and large, the dots fit quite neatly on a straight, downward-sloping line. The more an item rises in price, the less of it we buy. There is no overwhelming evidence here of either Giffen or Veblen goods, which by their very nature make most economists feel a shade uncomfortable. But there are a few interesting results nonetheless.
Not all of the dots in our chart lie perfectly on that downward-sloping straight line. Some are much nearer the horizontal axis, and some much nearer the vertical axis. What this is telling us is that some categories of household spending have an unusually low, and some an unusually high price elasticity of demand. The price elasticity of demand for a product measures the responsiveness of demand to a change in price. If the demand for a product is price elastic, the percentage change in the quantity demanded will, in absolute terms, exceed the percentage change in price. If the demand for a product is price inelastic, the percentage change in the quantity demanded will, in absolute terms, be less than the percentage change in price. In our chart, items that lie between the horizontal axis and the green line have an unusually low price elasticity, while items that lie between the vertical axis and the green line have an unusually high price elasticity.
Food is perhaps the standout item. It is positioned almost perfectly on the horizontal axis. There has been no change in the consumption of food, relative to the consumption of all goods and services, even though, over the period 2016 Q2 to 2017 Q1, it fell in price by some 3%, relative to the prices of all goods and services. People generally like to consume a fairly stable quantity of food. Eat much less, and you will quickly become very hungry. Eat much more, and you will quickly become full. Or fat. The demand for food is highly price inelastic. That makes sense.
There are other outliers. Clothing and footwear lies a long way above the line. Over the period 2016 Q2 to 2017 Q1, clothing and footwear fell slightly in price relative to the prices of all goods and services. And yet the quantity purchased rose substantially in relative terms. It would seem that the demand for clothing and footwear is highly price elastic. Again, that seems reasonable to us. More surprising, and indeed encouraging, is that the demand for alcohol and tobacco also appears to be price elastic. Not just within Fathom, but across the UK as a whole. The price of alcohol and tobacco has risen significantly since the vote to leave the EU. In response, the quantity purchased has fallen dramatically, and by more than would be the case for most goods and services. Since the introduction of the European System of Accounts 1995 (ESA 95 for short), the consumption category known as ‘alcohol and tobacco’ has included consumption of narcotics, in addition to consumption of alcohol and tobacco (more disaggregated data show that the split in 2016 was, approximately, 40% alcohol, 40% tobacco and 20% narcotics!). It may be that, as a nation, we are less drug dependent than some would have us believe!
What of the future? In Fathom’s view, sterling will continue to fall, and the price of imported goods and services will continue to rise. In this environment, it pays to be importing products the demand for which is price inelastic, rather than price elastic. Favour food retailers, over those who sell clothing and footwear!